
Let me help you
Welcome! Have a look around to see what I can do for you. If it's anything visual, I'm pretty sure I can help you!
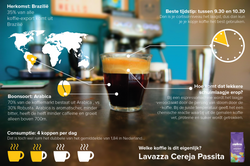
Create data
visualisations for you
I can create all kinds of datavisualisations for you. Whether it's an infographic, infomotion or a visualised report, I can transfer your black and white data into a colourful, appealing and engaging visual.
I have done this for many projects. One of my partners in this process is 2BHonest - https://2bhonest.nl/
 |  |  |  |  |
|---|---|---|---|---|
 |  |

Enlarge the visual skills of your employees
Datavisualisation is absolutely a skill and requires time and effort to do it well. However, a number of key design rules, process guidelines and smart tools will help you get on the right track. Contact me for:
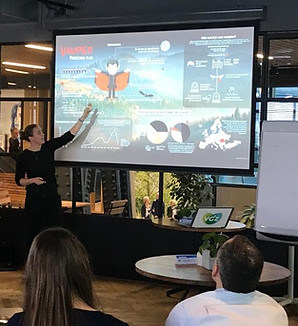
Talk: the Power of Datavisualisations
Datavisualisations are very powerful, in a good and also sometimes bad way. This talk takes you through the essentials of datavisualisation and gives the audience a new pair of glasses to look at visuals.
Time: from 30-60 minutes
Workshop: visualise your data
Get going with a pre-defined visualisation challenge. I introduce you to various tools, share more insights and help your people to visualise their own data in a hands-on training session.
Time: one off full day or sequence of 2-3 times half day (more in-depth)
Visualisation coaching
One-on-one (or small groups) coaching to empower your people in an intensive and very personal way.
Time: various